hifa_tsysflagcontamination
Note
Parameters set to None will use intelligent defaults from the pipeline context.
Pass explicit values to override context defaults.
- hifa_tsysflagcontamination(vis=None, caltable=None, filetemplate=None, logpath=None, remove_n_extreme=None, relative_detection_factor=None, diagnostic_plots=None, continue_on_failure=None, parallel=None)[source]
Flag astronomical line contamination in the system temperature (Tsys) calibration table.
Identifies and flags channel ranges in the Tsys spectrum where astronomical line emission is detected. Differences in line emission profiles due to variations in spatial position and spectral resolution between the Tsys spectrum and the autocorrelation spectrum can introduce mis-calibration in the affected channels. This task corrects the Tsys contamination;
hifa_renormhandles the corresponding autocorrelation issue.The heuristics compare Tsys spectra from CALIBRATE_ATMOSPHERE scans toward the science source (and sometimes the phase calibrator) against the Tsys spectrum from the bandpass calibrator. The hypothesis is that these should be similar except for atmospheric line profile differences due to airmass, and any astronomical line contamination. Channel ranges where the difference exceeds the detection threshold are flagged.
Configurable parameters:
relative_detection_factor(default: 0.5 %): minimum line-to-continuum ratio below which possible astronomical line features are ignored.remove_n_extreme(default: 2): number of deviant Tsys profiles to ignore when building the comparison.
The WebLog report shows three sections:
Tsys plots similar to those from
h_tsyscal/hifa_tsysflagbut with the detected contaminated ranges already flagged.Diagnostic plots — a two-panel graph per source (CALIBRATE_ATMOSPHERE intent), per spw, per EB. The left panel shows the averaged Tsys toward the science fields (blue), toward the bandpass (orange), their difference (green), and an atmospheric opacity model (dashed red). Detected contamination ranges are shown in red. The right panel shows the difference corrected by the atmospheric model.
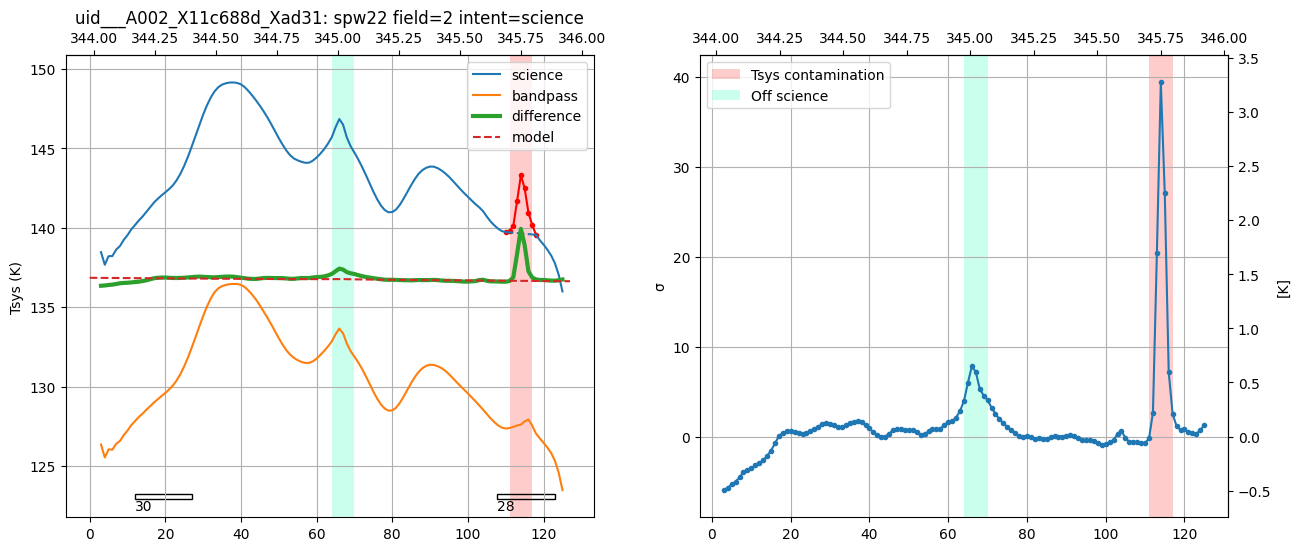
Example diagnostic plot. Left panel: averaged Tsys profile toward science fields (blue) and bandpass (orange), their difference plus a constant offset (green), atmospheric opacity model (dashed red), and detected contamination ranges (red). Right panel: difference corrected by the atmospheric model, with dual y-axis (K and approximate SNR).
A flag summary table and the specific flag command template text.
- Parameters:
vis -- List of input MeasurementSets (Not used).
caltable --
List of input Tsys calibration tables. Default: [] - Use the table currently stored in the pipeline context.
Example: caltable=['X132.ms.tsys.s2.tbl']
filetemplate -- output file to which regions to flag will be written
logpath -- output file to which heuristic log statements will be written
remove_n_extreme --
expert parameter for contamination heuristic
Default: 2
relative_detection_factor --
expert parameter for contamination detection heuristic
Default: 0.005
diagnostic_plots --
create diagnostic plots for the line contamination heuristic
Default: True
continue_on_failure --
controls whether pipeline execution continues if a failure occurs in the underlying contamination detection heuristic.
Default: True
parallel --
Process multiple MeasurementSets in parallel using the casampi parallelization framework.
Options:
'automatic','true','false',True,FalseDefault:
None(equivalent toFalse)
- Return type:
ResultsList[Results]
Notes
QA = 1.0 if no Tsys contamination detected.
QA = 0.9 if contamination ranges were detected and flagged.
QA = 0.6 with a warning message in any of the following cases:
'Large difference between the bandpass telluric line and...' — an uncorrected telluric residual may also appear in the autocorrelations and may need manual flagging in
hifa_renorm.'Astronomical contamination covering a wide frequency range...' — the identified range is too wide to be reliable; no flagging was done.
'Large residuals...' — the hypothesis that Tsys profiles should be similar is not fulfilled; results may be unreliable (possibly caused by very broad line contamination).
'Heuristic not applied:...' — the input data are not supported (multi-source multi-tuning, double-sideband Bands 9/10, or full-polarization data); no flags applied.
QA = -0.1 if the task did not run correctly.
Not applied in diffgain or full-pol recipes.
- Returns:
The results object for the pipeline task is returned.
- Return type:
ResultsList[Results]
Examples
Flag Tsys line contamination using currently recommended parameters:
>>> hifa_tsysflagcontamination()
Halt pipeline execution if a failure occurs in the underlying heuristic:
>>> hifa_tsysflagcontamination(continue_on_failure=False)