hifa_renorm
Note
Parameters set to None will use intelligent defaults from the pipeline context.
Pass explicit values to override context defaults.
- hifa_renorm(vis=None, createcaltable=None, threshold=None, spw=None, excludechan=None, atm_auto_exclude=None, bwthreshspw=None, parallel=None)[source]
Assess and optionally correct ALMA amplitude normalization errors caused by bright line emission.
When bright astronomical lines are present in the autocorrelations of science targets, the ALMA correlator's amplitude normalization can be incorrect, leading to under-scaled amplitudes in the affected channels. This task creates per-channel renormalization spectra (scaling spectra) and, optionally, stores them in a Tsys-like calibration table to be applied during
hif_applycal. (Prior to PL2024 the correction was applied by editing the MS directly.)The algorithm compares the autocorrelations of the bandpass calibrator (assumed line-free) to those of the science target. After dividing out the bandpass autocorrelation, an iterative polynomial baseline fit (up to fifth order) is performed to isolate any line contamination and determine the per-channel rescaling needed. Spectral windows with many channels are split into fitting segments, and the code checks for features at segment boundaries and adjusts them accordingly. When
atm_auto_exclude=True(default) any strong atmospheric features are excluded from the fit.Renormalization is applied only when a scaling value >
threshold(default: 1.02, i.e. > 2%) is found for a given target, spw, scan, field, antenna, and correlation.Renormalization is not needed for TDM spectral windows. Bands 9 and 10 (double-sideband receivers) rarely require renormalization and are treated specially.
The WebLog main page table shows the maximum renormalization value found per target, per spw. Rows with values above the threshold are highlighted in blue (when
createcaltable=True) or red (whencreatecaltable=False). Summary plots show the cumulative-average scaling spectra per field and spw. PDF files contain per-antenna, per-correlation diagnostic scaling spectra. A warning message 'Number of Segments Changed!!!' appears on summary plots when the number of fitting segments varies across fields being averaged together.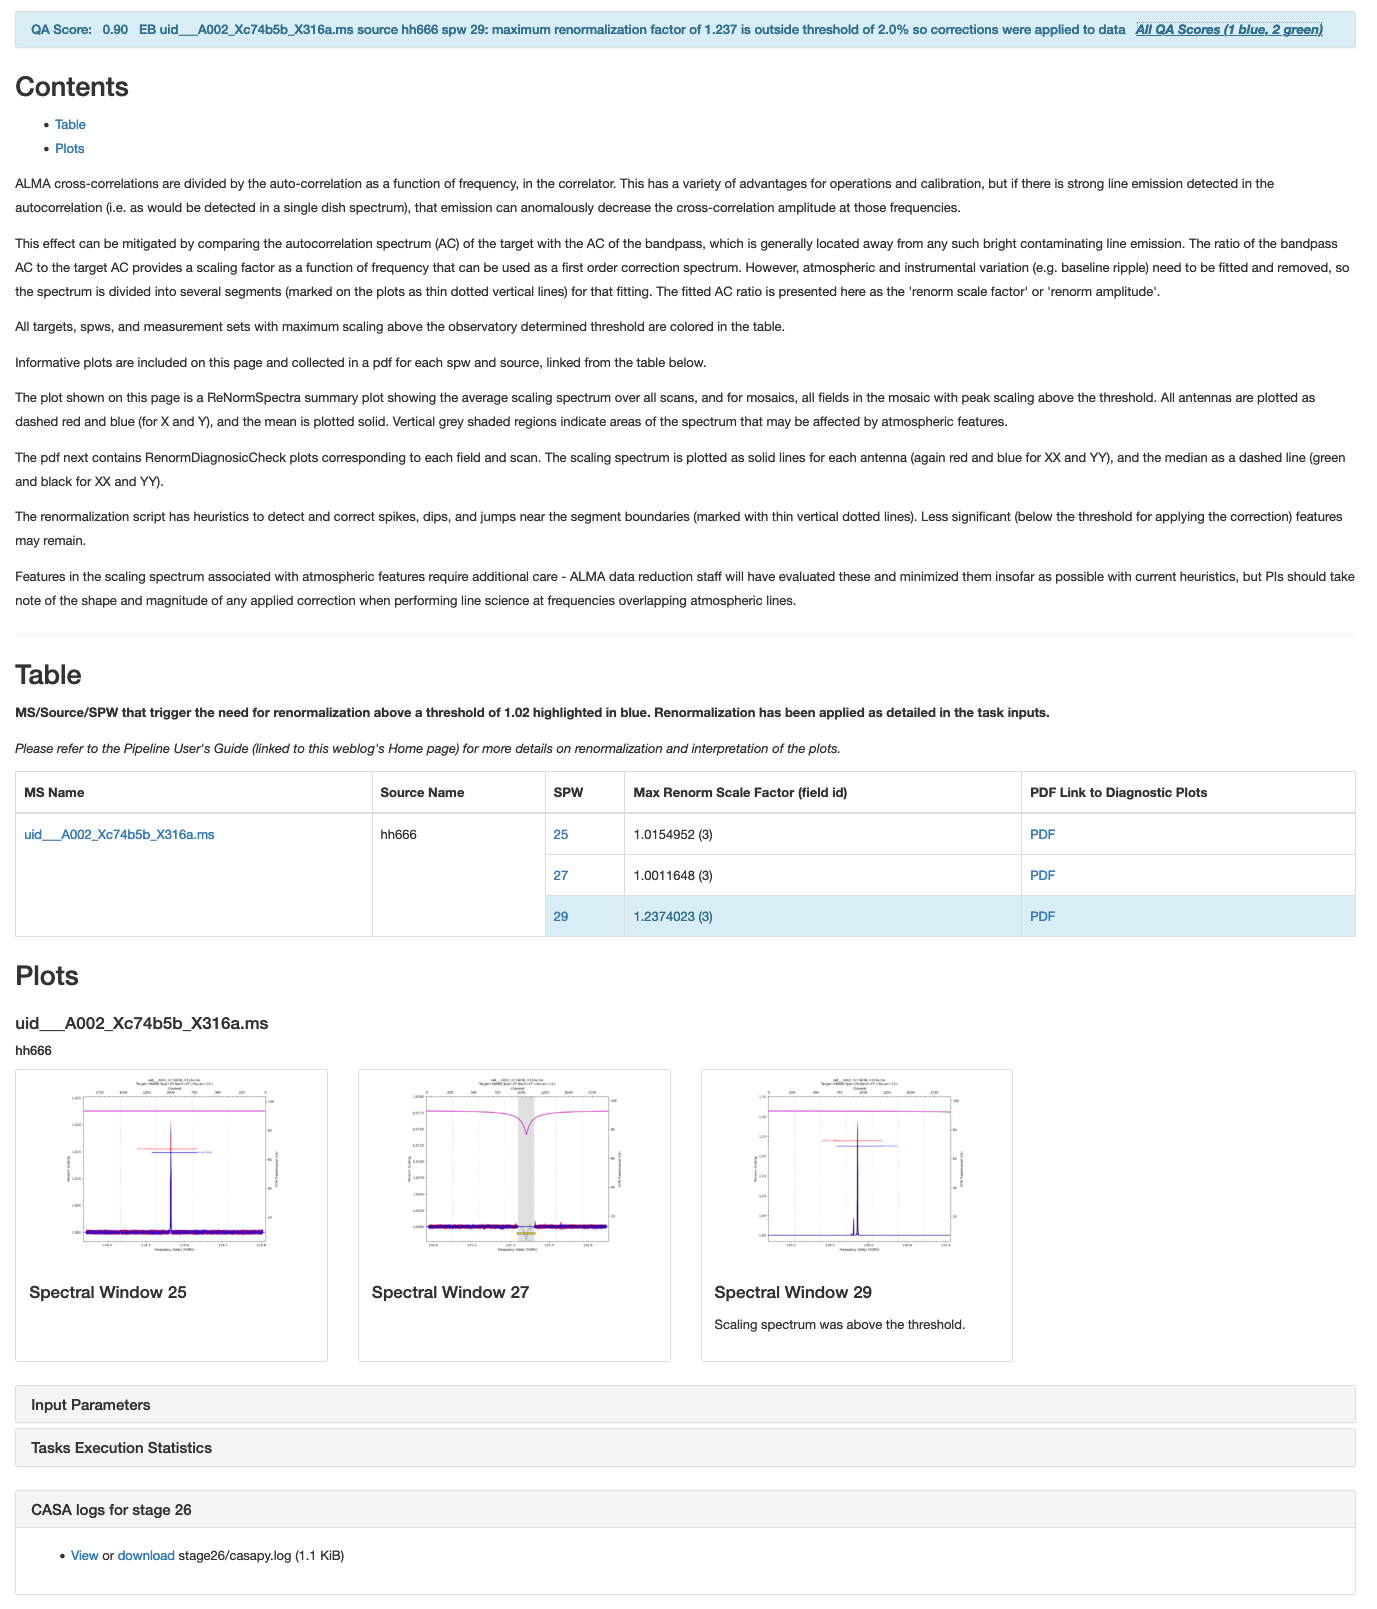
WebLog for the
hifa_renormstage. Table rows highlighted blue indicate values above the threshold (default: 1.02 / 2%). Summary plots show cumulative-average renormalization spectra per field/spw.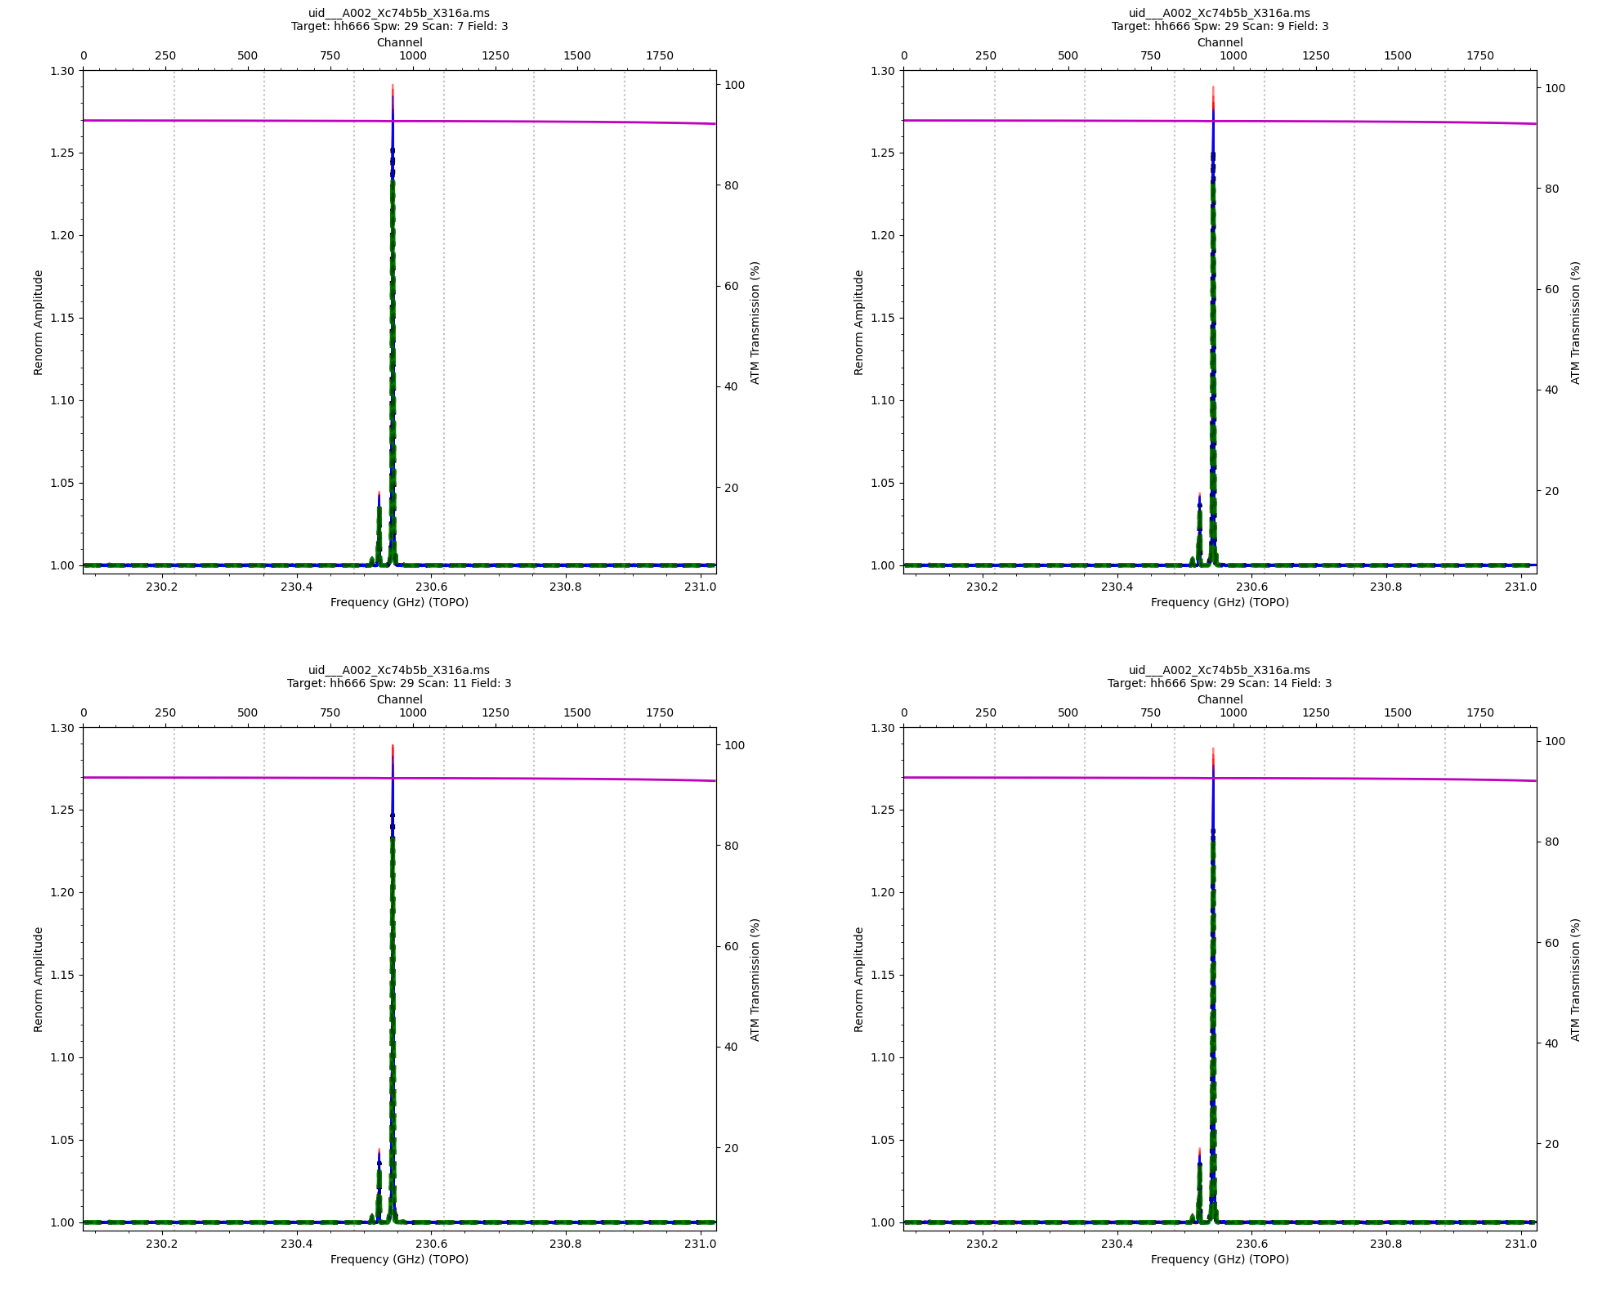
PDF screenshot for an EB/target/spw where renormalization is applied. The CO line causes atypically high scaling > 1.25 (25%).
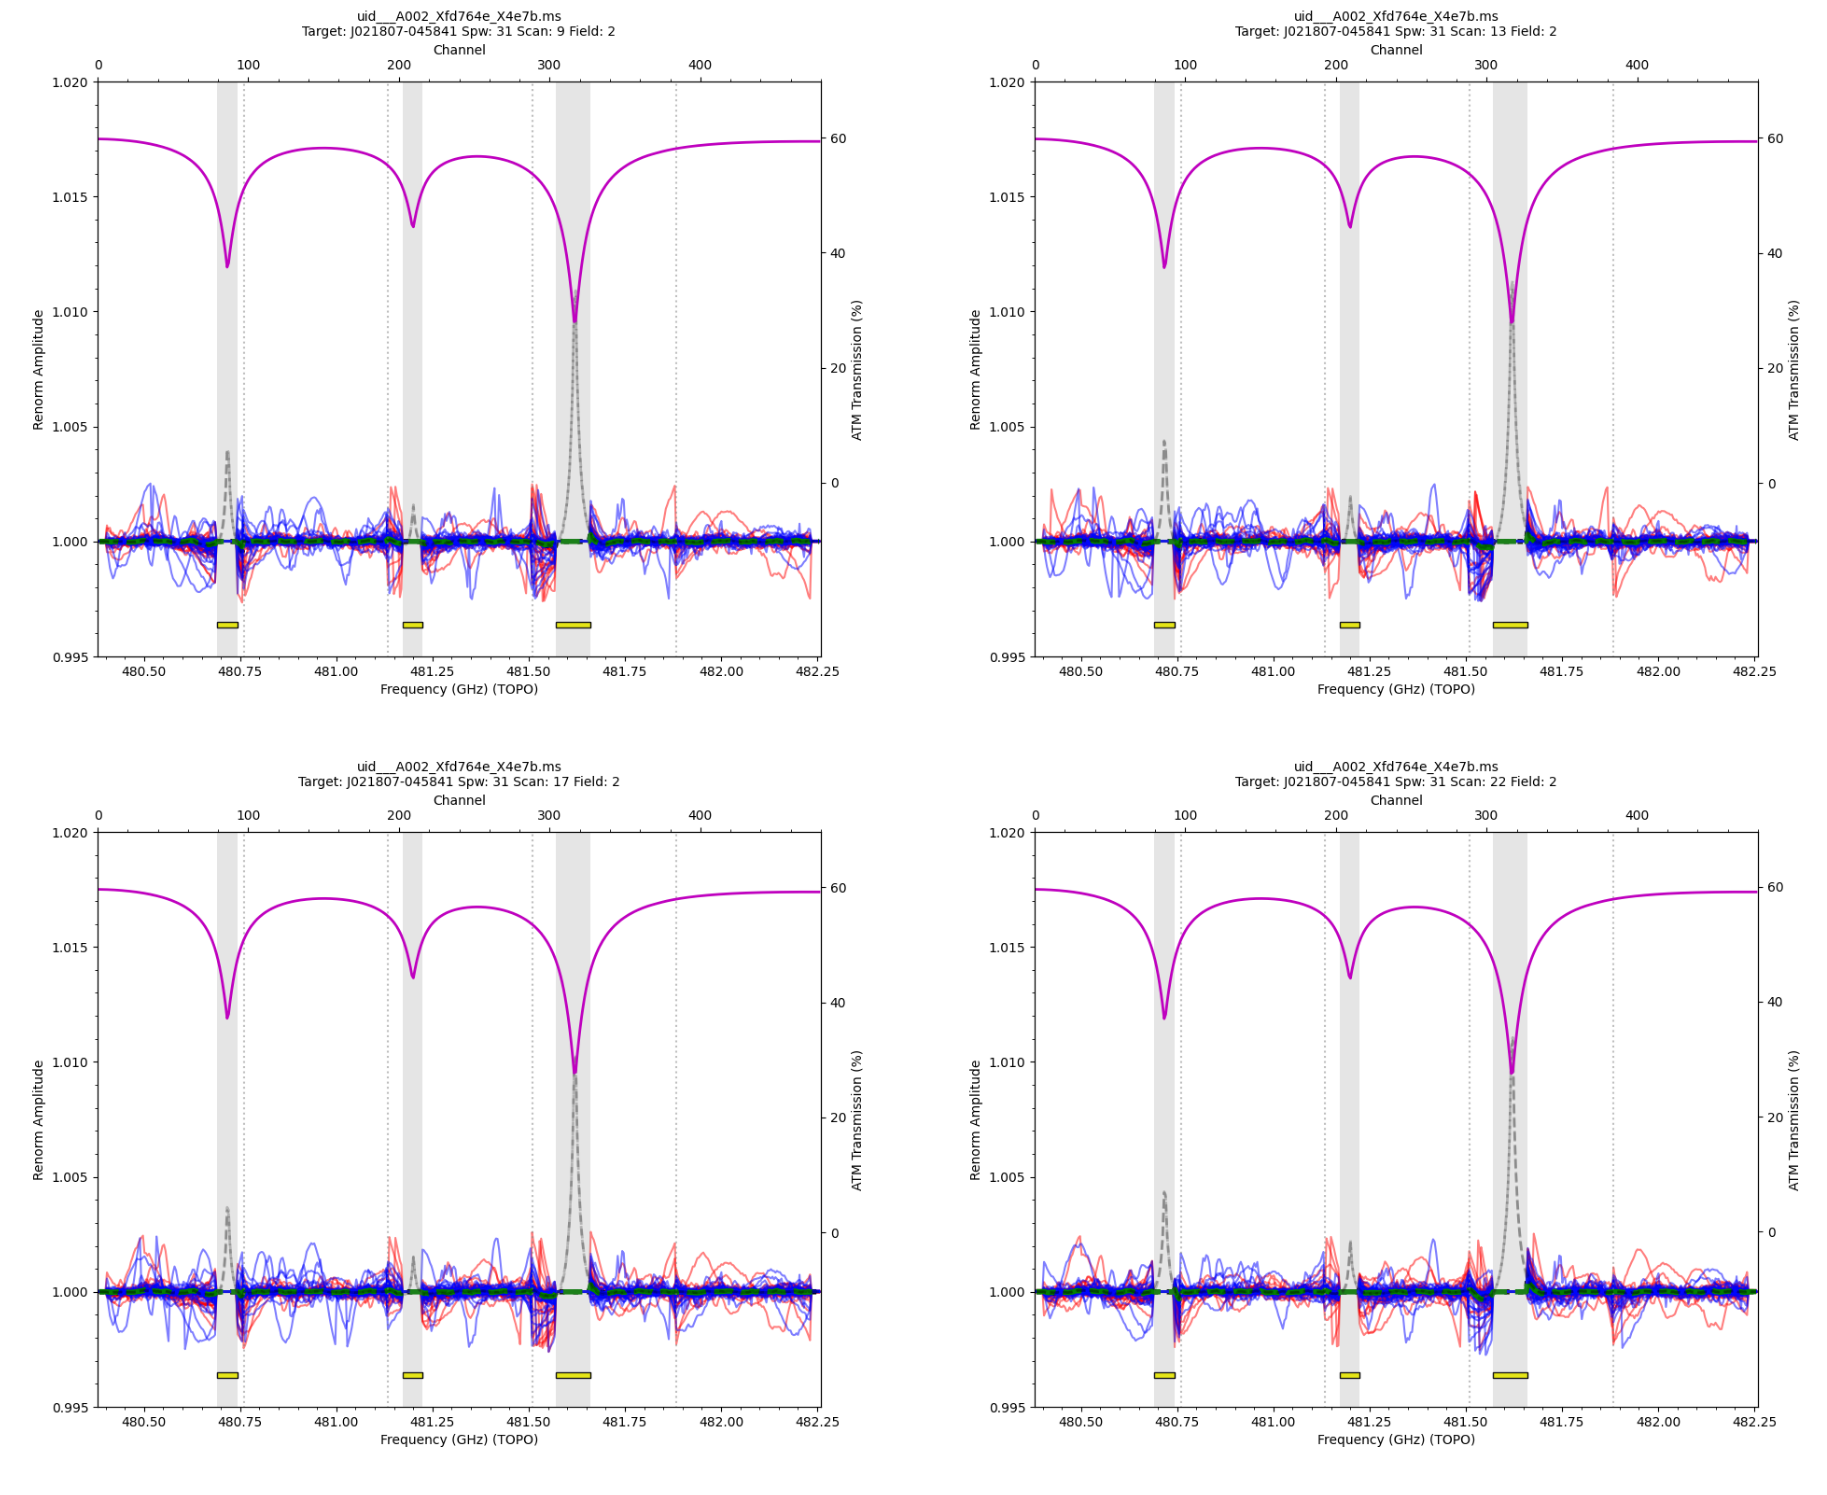
PDF where atmospheric regions are automatically excluded (semi-opaque grey). Excluded spectra appear as grey dashed lines; yellow boxes mark excluded frequency ranges. When no real astronomical lines are present, renormalization is not applied.
- Parameters:
vis --
List of input MeasurementSets. Defaults to the list of MeasurementSets specified in the pipeline context.
Example:
vis=['ngc5921.ms']createcaltable --
Boolean to select whether to create the renormalization correction cal table (True), or only run the assessment (False, default).
Example:
createcaltable=Truethreshold --
Apply correction if max correction is above this threshold value and
apply= True. Default is 1.02 (i.e. 2%).Example:
threshold=1.02spw --
The list of real (not virtual - i.e. the actual spwIDs in the MS) spectral windows to evaluate. Set to spw='' by default, which means the task will select all relevant (science FDM) spectral windows. Note that for data with multiple MSs, a list with the correct spectral window selection for each MS can be provided.
Examples:
spw='11,13,15,17'spw=['11,13,15,17', '5,7,11,13']
excludechan --
Channels to exclude in either channel or frequency space (TOPO, GHz), specifying the real (not virtual) spectral window per selection. Note that for data with multiple MSs, a list of dictionaries with the correct selection for each MS can be provided.
Examples:
excludechan={'22':'100~150;800~850', '24':'100~200'}excludechan={'22':'230.1GHz~230.2GHz'}excludechan=[{'22':'100~150'}, {'15':'100~150'}]
atm_auto_exclude -- Automatically find and exclude regions with atmospheric features. Default is False
bwthreshspw --
Bandwidth beyond which a SPW is split into chunks to fit separately. The default value for all SPWs is 120e6, and this parameter allows one to override it for specific SPWs, due to needing potentially various 'nsegments' when EBs have very different SPW bandwidths.
Example:
bwthreshspw={'16: 64e6, '22: 64e6}parallel --
Process multiple MeasurementSets in parallel using the casampi parallelization framework.
Options:
'automatic','true','false',True,FalseDefault:
None(equivalent toantomatic)
- Return type:
ResultsList[Results]
Notes
The QA score reflects the magnitude of the maximum scaling factor R_f found, relative to the threshold R_th (default: 1.02):
R_f < R_th: QA = 1.0 - (1.0 - 0.90) x (R_f - 1.0) / (R_th - 1.0) -- green, 0.90-1.0
R_th <= R_f < 2.5: QA = 0.9 - (0.9 - 0.66) x (R_f - R_th) / (2.5 - R_th) -- blue, 0.67-0.9
R_f >= 2.5: QA = 0.66 -- yellow
Bands 9 and 10 receive a fixed QA = 0.9 (blue) regardless of R_f.
If R_f is erroneous or unrealistic (< 1 or > 2.5), an additional QA message is issued.
- Returns:
The results object for the pipeline task is returned.
- Return type:
ResultsList[Results]
Examples
1. Run with recommended settings to assess the need for an ALMA amplitude renormalization correction.
>>> hifa_renorm()
2. Run to assess the necessary ALMA amplitude renormalization correction, and apply this correction if it exceeds a threshold of 3% (1.03).
>>> hifa_renorm(createcaltable=True, threshold=1.03)